VanillaPlus managing editor, George Malim, assesses the extent to which augmented analytics will enable communications service providers and enterprises to uncover valuable insights from across their data lakes, warehouses, and pools in this in this article.
Enterprises across the globe are drowning in data
There are lakes, warehouses, server farms and repositories that are full to bursting with data gathered from the digital processes of organisations. Within this are gold nuggets of transformational insights but too often these are the proverbial needles to be discovered in giant haystacks.
Performing analytics is vital to uncover these nuggets and needles but data scientists are in short supply and the volume of data involved demands automated tools to be both quick enough to generate valuable insights and cheap enough to be viable at scale.
Augmented analytics is a concept that has emerged to address this need.
What is Augmented Analytics?

Analyst firm Gartner was first to define augmented analytics in 2017 and describes it as the use of enabling technologies such as machine learning and artificial intelligence (AI) to assist with data preparation, insight generation and insight explanation to augment how people explore and analyse data in analytics and business intelligence (BI) platforms. These technical capabilities enable expert and non-specialist personnel, described by the firm as citizen data scientists, by automating many aspects of data science, machine learning and AI model development, management and deployment.
The concept of citizen data scientists is important here because enabling citizens to perform analytical queries is a vital step to democratising access to insights. In addition, the cost of expert data scientists plus their relative lack of availability means it is not possible for most to gain in-depth analytical capabilities. Hence the need for augmentation of analytics.
Augmented Analytics growth and projections
Significant progress has been made in the last three years towards enabling this greater democratisation and Gartner has reported that in 2019 approximately 50% of analytical queries were generated via search, natural language processing (NLP), voice or were automatically generated. This simplification and momentum have resulted in augmented analytics becoming a dominant driver of new purchases of analytics and BI, data science and machine learning platforms, according to the firm. This is borne out by positive market projections that put substantial dollar figures on the global augmented analytics market.
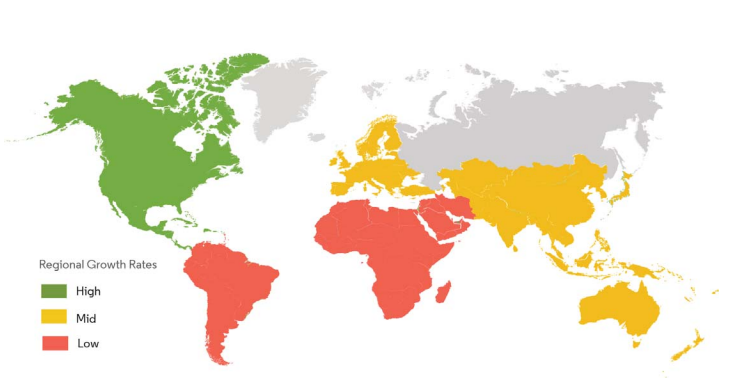
Research and Markets, for example expects the market to grow to US$18.4bn by 2023. Mordor Intelligence predicts the augmented analytics market will achieve a compound annual growth rate (CAGR) of 31.2% during the period 2021 -2026, stating that, with the dominance of business intelligence, augmented analytics solutions have been designed to facilitate automated insights that can be utilised to assess factors such as performance and overall brand health, identify growth opportunities and to determine a holistic understanding of how a brand fits into the marketplace.
The firm has highlighted expected growth rates for regions across the world in Figure 1. Research firm, Technavio, which has been monitoring the augmented analytics market and projects similar growth. The firms say the market is poised to grow by US$17.44bn during 2020-2024, progressing at a CAGR of 30% during the forecast period.
Why is augmented analytics needed?
Organisations have invested heavily and embraced big data concepts and infrastructure. However, this was simply a plumbing phase to ensure data availability for analysis but the collection and storage of data is not the ultimate destination. Big data’s importance has been recognised and its role in decision making across a business is increasingly well understood but the sheer volume of data available to organisations is making effective interpretation a real challenge. According to Forrester Research, less than 0.5% of all data is ever analysed and used while just 12% of enterprise data is used to make decisions. This situation will only be exacerbated by the growth in IoT connected devices which is expected to generate 79.4 zetabytes (ZB) of data across 41.6 billion devices, according to an IDC forecast.
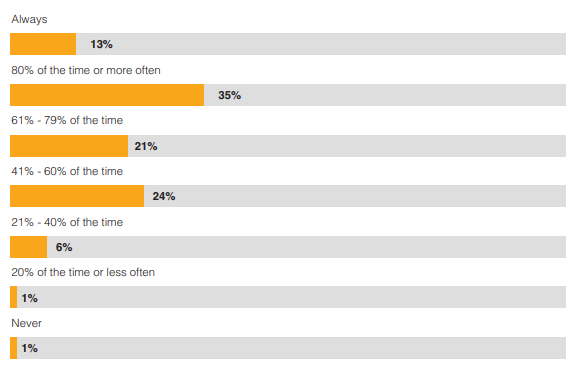
According to Aberdeen Strategy and Research data, presented in Figure 2, only 13% of companies are able to always access information within the timeframe necessary to make data-driven decisions. Half of all companies in IT, retail and financial services, among other sectors, said their decision window has narrowed noticeably or substantially over the past two years.
IT leaders need more information more quickly to make decisions and 58% of executives said that they need data in real-time in order to make decisions.
A further challenge is that processes remain manual and prone to bias across the data value chain. This includes managing and preparing the data for analysis, building machine learning and AI models, interpreting the results, and making insights actionable. Using the current analytics approach, business users find the patterns they were expecting to see, and data scientists build and manage their own models. This results in exploring their own hypotheses, missing key findings, and interpreting conclusions incorrectly. This will adversely affect decisions, actions and outcomes. According to Forrester Research, only 29% of organisations are successful at connecting analytics to actions.
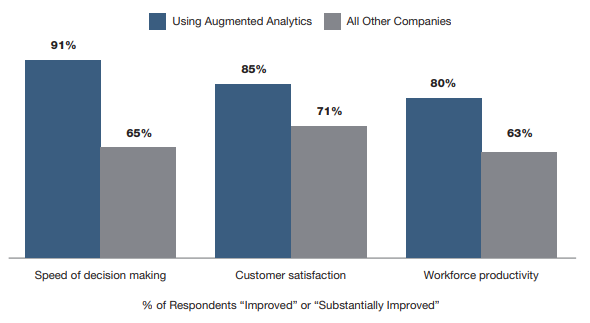
According to Aberdeen Strategy and Research, a split is developing in the market because of this with some thinking that only the most technically-able and data-aware employees will be able to maximise the benefits of augmented analytics while others think empowering all users with tools to help them sift through data, while drawing on their business knowledge and experience, will achieve the same or better results. The firm’s research in Figure 3 demonstrates how companies that have invested in augmented analytics capabilities are enjoying an elevated sense of user satisfaction in several key areas of their decision process.
According to the research, those companies that have invested in augmented analytics have achieved:
• 23% greater year-on-year increase in operational profit
• 31% greater year-on-year improvement in employee retention
• 35% greater year-on-year increase in total customers
End-to-end augmented analytics platforms are therefore demonstrating they can help enterprises make faster and better decisions by using artificial intelligence (AI) across the data value chain. Systems such as the recently launched HyperSense no-code, elastic, cloud native augmented analytics platform, from Subex, provide organisations with a platform upon which they can extend analytics capabilities throughout their organisations.
How citizens can be data scientists
Systems such as this can turn a business’s citizens into data scientists because augmented analytics reduces dependencies on human skills by enabling plain language queries and abstraction of sophisticated and complex data management away from non-skilled users.
Augmented analytics adds further value because it enables identification of hidden patterns in data while removing human bias. Augmented analytics has the potential to embed automated insights into enterprise software applications in an actionable manner, says the Institute of Engineering and Technology in a recent report. This is because, in theory, an augmented analytics engine can sift, cleanse, analyse and present the data ready for use by people or software mechanisms, transforming data into actionable information with minimal specialist human supervision. This has the potential to provide analytical insights to smaller corporate entities at lower costs, levelling the playing field between large and small organisations.
Gartner also foresees continued growth of citizen data scientists. The analyst firm says that throughout 2020, the number of citizen data scientists will grow five times faster than professional data scientists. Citizen data scientists use augmented analytics tools to automatically identify data sets, develop hypotheses and identify data patterns.
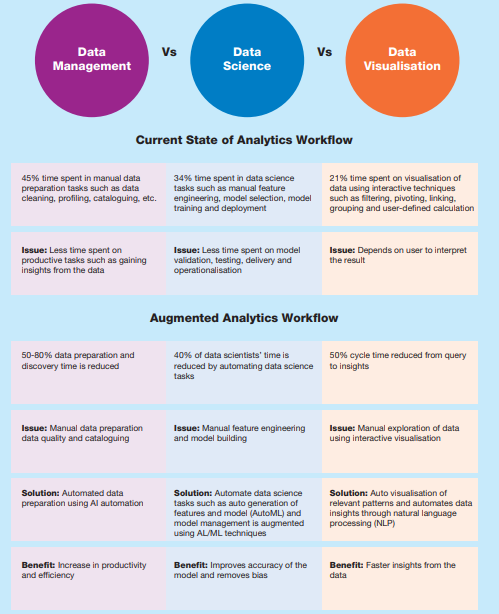
Businesses are looking to citizen data scientists to enable and scale data science capabilities. Gartner predicted in 2019 that by 2020, more than 40% of data science tasks would have been automated, resulting in increased productivity and broader use by citizen data scientists. Figure 4, from Subex, details the potential benefits of moving from a traditional analytics workflow to an augmented analytics workflow.
How to integrate Augmented Analytics into your business

While not all organisations have integrated augmented analytics into their business intelligence strategy, many are assessing how they will do so. There are a number of important considerations here, but deployment should not be undertaken in isolation.
Becoming data-driven is an organisational as well as technical shift so appropriate training and support as well as incentivisation to fully-utilise all available tools should form part of the augmented analytics strategy. There are a series of actions that companies can take in preparation for modernising their business reporting.
According to Aberdeen Strategy and Research, the top two actions that organisations have taken to bring reporting into the future are to invest in employee training and to deploy analytics in the cloud. The firm’s data has uncovered that 42% of organisations are already starting to improve the reporting and analytical skills of employees. Another 38% of respondents have indicated they have deployed analytics in the cloud or a software-as-a-service (SaaS) environment. The role cloud-based approaches take in enabling
augmented analytics is set to account for a significant component of growth in uptake. Allied Market Research predicts in that cloud-based deployment of analytics is set to show the greatest growth in augmented analytics take up in the period 2017-2025, in comparison to on-premise systems. The firm, in line with other predictions cited at the start of this report, valued the global augmented analytics market at US$4.09bn in 2017 and it projects this will reach US$29.85bn by 2025, growing at a CAGR of 28.4% from 2018 to 2025.
How Augmented Analytics increases productivity
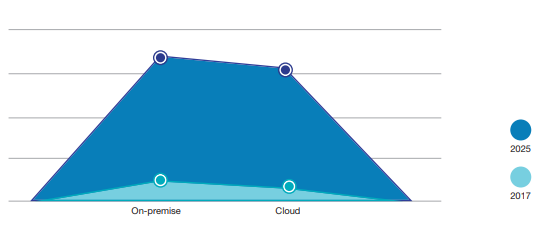
Source: Allied Market Research
Augmented analytics automates the data insights by utilising machine learning and natural language generation for automating data preparation, data discovery and the sharing of insights. It is gaining so much attention, with new tools and systems coming to market both in the cloud and on-premises markets, because it embellishes and enables the basic big data ideals of harnessing the power of data to optimise business performance. By embedding artificial intelligence in business intelligence tools to make the analytics work easier for citizen data scientists and other non-skilled business users, augmented analytics has the potential to remove the obstacles to processing data and acting upon insights in near real-time. This frees up specialised data scientists from focusing on routine, repeated tasks and enables them to focus on specialised problems.
In essence, businesspeople can use augmented analytics capabilities to ask straightforward questions in plain language while data scientists can handle the more sophisticated queries, prioritising bringing the most relevant actionable insights to decision makers. They will spend less time exploring data, looking for patterns and insights as a consequence.
This democratisation of analytics is a way to handle the shortage of data scientists but also to empower workers and take them with the organisation on its journey to becoming data-led in its decision making. Augmented analytics increases productivity, fosters awareness in enterprises of how to utilise growing streams of data from various sources in innovative ways and it makes work easier for citizen data scientists and business users.
Enjoyed this article? Read the accompanying full VanillaPlus CEO Guide to Augmented Analytics
This report first appeared on www.VanillaPlus.com. Register now to access free reports, webinars, and a quarterly digital magazine.